
The causality network, a complex interwoven system of cause-and-effect relationships, underpins many phenomena observed in the natural and social sciences. Comprehending its intricacies is fundamental for accurate prediction, effective intervention, and the development of robust models across diverse fields. This article aims to elucidate the principles of causality networks, explore their various forms, and discuss the methodologies employed in their analysis, providing a framework for understanding these often-opaque systems.
Causality, at its core, refers to the relationship between an event (the cause) and a second event (the effect) where the second event is a direct consequence of the first. In a network setting, this concept expands to encompass a multitude of interconnected causes and effects, forming a dynamic and often recursive structure. You can learn more about the block universe theory in this insightful video.
Distinguishing Causation from Correlation
A common pitfall in scientific inquiry is the conflation of correlation with causation. Correlation indicates a statistical relationship between two variables, where changes in one are associated with changes in the other. However, correlation does not inherently imply that one variable directly influences the other.
- Spurious Correlations: These are coincidental relationships between variables that do not share a causal link. For example, an observed correlation between ice cream sales and drowning incidents does not mean ice cream consumption causes drowning; both are likely influenced by a third, unobserved factor, such as warm weather.
- Reverse Causation: In some instances, the presumed effect might, in fact, be the cause. For example, while it might seem that better grades lead to studying more, it could also be argued that studying more leads to better grades, or indeed, the relationship is reciprocal.
- Common Cause Confounding: A lurking variable, unobserved and unaccounted for, can influence both the supposed cause and effect, leading to an apparent correlation that is not truly causal. This is a significant challenge in observational studies. Consider the perceived link between coffee consumption and heart disease; lifestyle factors like smoking, often associated with coffee drinking, might be the true common cause.
The Criteria for Causality
Determining true causality often involves satisfying several criteria. These criteria, while not always individually sufficient, collectively strengthen the case for a causal link.
- Temporal Precedence: The cause must precede the effect in time. An event cannot cause something that occurred before it.
- Covariation (Association): There must be an observable statistical relationship between the purported cause and effect.
- Non-Spuriousness: The observed relationship should not be explainable by other, common causes or confounding variables. This often requires controlling for known confounders.
- Plausibility (Mechanism): A credible theoretical or mechanistic explanation for how the cause leads to the effect strengthens the causal argument. While not strictly necessary for identifying a causal link, it enhances understanding and provides a basis for intervention.
- Consistency: The causal relationship should be replicable across different studies, populations, and contexts.
- Specificity (Dose-Response): A clear dose-response relationship, where increased exposure to the cause leads to a proportionally increased effect, further supports causality.
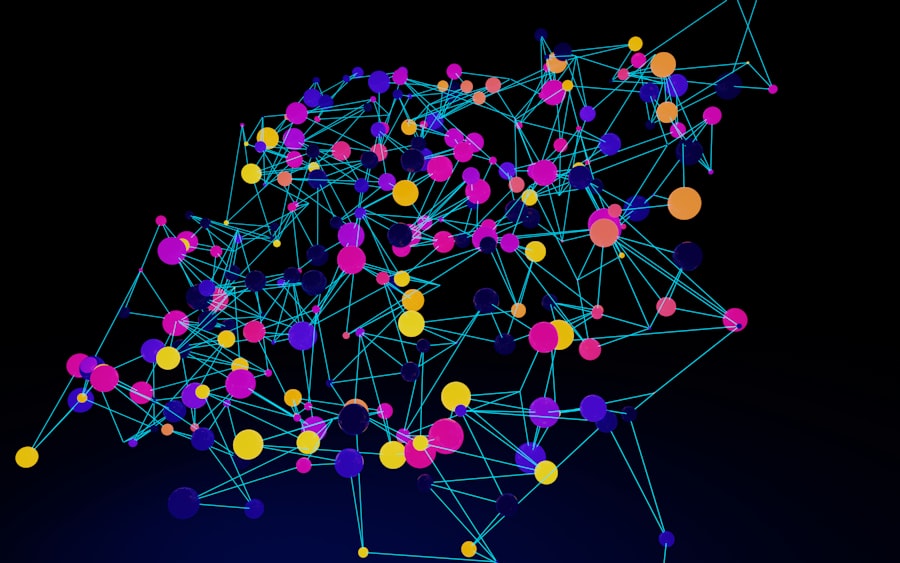
Causality network graphs are essential tools for visualizing and understanding the relationships between different variables in complex systems. For a deeper exploration of this topic, you can refer to the article on My Cosmic Ventures, which discusses the applications and methodologies of causality network graphs in various fields. To read more, visit this article.
Types of Causal Relationships
Causal relationships within a network can manifest in various forms, each contributing to the overall complexity of the system. Understanding these diverse types is crucial for accurate causal inference.
Direct vs. Indirect Causation
- Direct Causation: A direct causal link exists when one variable directly influences another without any intervening variables. For example, turning a light switch directly causes the light to turn on (assuming a functional circuit).
- Indirect Causation (Mediation): Indirect causation occurs when one variable influences another through one or more intermediary variables. For instance, increased rainfall (cause) might lead to increased plant growth (effect) by first increasing soil moisture (mediator). The rainfall doesn’t directly stimulate plant growth but acts through the soil moisture.
Unidirectional vs. Bidirectional Causation
- Unidirectional Causation: The causal flow is in one direction only. A causes B, but B does not cause A. For example, a rock rolling down a hill causes a splash in a puddle, but the splash does not cause the rock to roll up the hill.
- Bidirectional Causation (Reciprocal Causation): Both variables influence each other. This often creates feedback loops within the network. Consider the relationship between exercise and mood: exercise can improve mood, and an improved mood can motivate further exercise.
Linear vs. Non-linear Causation
- Linear Causation: The effect is proportional to the cause, often represented by a straight-line relationship. For example, within a certain range, increasing the pressure on a spring linearly increases its compression.
- Non-linear Causation: The relationship between cause and effect is not proportional and can exhibit complex patterns. This might involve thresholds, saturation points, or exponential growth. For instance, the impact of a small amount of fertilizer on plant growth might be linear, but beyond a certain point, additional fertilizer could have diminishing returns or even become detrimental due to nutrient toxicity.
Methodologies for Causal Inference

Disentangling causal relationships from mere correlations often requires sophisticated methodologies. These approaches aim to isolate the effect of a specific cause while accounting for confounding variables.
Randomized Controlled Trials (RCTs)
RCTs are considered the gold standard for establishing causal relationships, particularly in medicine and social sciences. In an RCT, participants are randomly assigned to either a treatment group (receiving the purported cause) or a control group (not receiving the cause or receiving a placebo).
- Random Assignment: This is the cornerstone of RCTs. Randomization ensures that, on average, the two groups are comparable in all observed and unobserved characteristics, except for the exposure to the treatment. This minimizes the influence of confounding variables.
- Blinding: To further reduce bias, blinding can be employed. In a single-blind study, participants are unaware of their assignment. In a double-blind study, both participants and researchers interacting with them are unaware.
- Limitations: While powerful, RCTs can be ethically problematic or practically impossible for certain research questions (e.g., studying the effects of smoking). They may also lack external validity if the study population is not representative of the broader population.
Observational Studies and Quasi-Experimental Designs
When RCTs are not feasible, researchers often turn to observational studies. These studies observe and analyze existing data without direct intervention. However, establishing causality in observational studies is far more challenging due to the potential for confounding.
- Propensity Score Matching (PSM): PSM attempts to mimic randomization in observational studies. It involves creating a statistical “match” between treated and control individuals based on their propensity (probability) of receiving the treatment, given their observed characteristics. This helps to balance the groups on observed confounders.
- Instrumental Variables (IV): IV analysis uses a variable (the instrument) that influences the cause but not directly the effect, and is also unrelated to any unobserved confounders. The instrument acts as a proxy for random assignment, allowing for causal inference even in the presence of unmeasured confounding.
- Regression Discontinuity Designs (RDD): RDD is applied when an intervention is assigned based on a continuous cutoff score. Individuals just above and just below the cutoff are assumed to be comparable, allowing for a causal estimate of the intervention’s effect around that threshold.
- Difference-in-Differences (DID): DID compares the change in an outcome over time between a group that received an intervention and a control group that did not. This approach accounts for time-invariant unobserved characteristics and general time trends.
Causal Discovery Algorithms
In situations where a priori knowledge about causal relationships is limited, causal discovery algorithms can be employed to infer causal structures from observational data. These algorithms typically rely on statistical dependencies and conditional independencies between variables.
- Constraint-based Algorithms (e.g., PC Algorithm, FCI Algorithm): These algorithms identify causal relationships by testing for conditional independencies between variables. They build a graph where edges represent causal links, and the absence of an edge implies conditional independence.
- Score-based Algorithms (e.g., GES Algorithm): These algorithms search for the causal graph that best fits the observed data, typically by optimizing a scoring function that balances model fit and complexity.
- Limitations: Causal discovery algorithms often assume faithfulness (all conditional independencies in the true causal graph are reflected in the data) and causal sufficiency (all common causes are included in the observed variables). Violations of these assumptions can lead to incorrect causal inferences.
Visualizing and Analyzing Causal Networks
Representing causal relationships visually is often instrumental in understanding complex systems. Various graphical models are employed for this purpose, providing intuitive frameworks for depicting causal flow.
Directed Acyclic Graphs (DAGs)
DAGs are widely used to represent causal relationships. In a DAG, nodes represent variables, and directed edges (arrows) indicate causal influence. The “acyclic” property signifies that there are no feedback loops, meaning a variable cannot directly or indirectly cause itself.
- Ancestors and Descendants: If an arrow points from A to B, A is an ancestor of B, and B is a descendant of A.
- Paths and D-Separation: DAGs allow for the identification of causal paths and the application of d-separation rules, which determine whether conditioning on a set of variables can block (d-separate) a path between two other variables, thereby rendering them conditionally independent. This is crucial for identifying confounding and mediation.
- Illustrative Example: Imagine a DAG with “Rainfall” -> “Soil Moisture” -> “Plant Growth.” Here, Rainfall is an ancestor of Plant Growth, and Soil Moisture mediates the relationship.
Bayesian Networks
Bayesian networks extend DAGs by incorporating conditional probability distributions for each node, given its parents. This allows for probabilistic reasoning about causal relationships and prediction of outcomes.
- Conditional Probabilities: Each node in a Bayesian network has a conditional probability table (CPT) that specifies the probability of that node taking on a particular value, given the values of its direct causes (parents).
- Inference: Bayesian networks can be used for various types of inference, including:
- Predictive Inference: Predicting the probability of an effect given a cause.
- Diagnostic Inference: Inferring the probability of a cause given an observed effect.
- Intervention Analysis: Predicting the effect of actively changing a variable (e.g., setting a variable to a specific value).
System Dynamics Models
System dynamics models are particularly useful for analyzing causal networks with feedback loops and time-dependent relationships. These models represent systems using stocks (accumulations), flows (rates of change), and feedback loops.
- Stocks and Flows: Stocks represent quantities that can accumulate or deplete (e.g., population size, amount of water in a reservoir). Flows represent the rates at which stocks change (e.g., birth rate, outflow rate).
- Feedback Loops: These are crucial elements of system dynamics models.
- Reinforcing (Positive) Feedback Loops: Amplify changes in the system (e.g., “the rich get richer” phenomenon).
- Balancing (Negative) Feedback Loops: Dampen or stabilize changes, bringing the system back towards equilibrium (e.g., thermostat controlling room temperature).
- Simulation: System dynamics models are often simulated over time to observe the emergent behavior of complex systems, revealing how various causal relationships interact and lead to dynamic outcomes.
Causality network graphs are powerful tools for understanding complex relationships between variables in various fields, including economics and epidemiology. For those interested in exploring this topic further, a related article can provide valuable insights into the practical applications of these graphs in real-world scenarios. You can read more about it in this informative piece on causality networks. This resource delves into the methodologies and case studies that illustrate how causality network graphs can enhance decision-making and predictive modeling.
Challenges and Future Directions
| Metric | Description | Typical Range | Significance |
|---|---|---|---|
| Node Count | Number of variables or entities in the network | 10 – 1000+ | Indicates the complexity of the causal system |
| Edge Count | Number of causal connections between nodes | Depends on node count and network density | Reflects the degree of interdependence among variables |
| Average Degree | Average number of edges per node | 1 – 10+ | Measures connectivity and influence spread |
| Clustering Coefficient | Degree to which nodes tend to cluster together | 0 – 1 | Indicates presence of tightly connected groups |
| Path Length | Average shortest path between nodes | 1 – N (depends on network size) | Measures efficiency of causal influence propagation |
| Edge Weight | Strength or confidence of causal relationship | 0 – 1 | Quantifies influence magnitude between nodes |
| Directionality | Indicates if edges have a direction (cause → effect) | Directed / Undirected | Essential for causal inference |
| Feedback Loops | Number of cycles where cause and effect form loops | 0 – N | Shows presence of reciprocal causation |
| Confidence Interval | Statistical confidence in causal links | Typically 95% | Indicates reliability of inferred causality |
The endeavor of understanding causality networks is rife with challenges, yet it continues to evolve with advancements in computational power and statistical methodologies.
Unobserved Confounding
The presence of unobserved confounders remains a persistent challenge in causal inference, especially in observational studies. If a common cause of both the treatment and the outcome is not measured and accounted for, it can lead to biased causal estimates.
- Proxy Variables: Researchers sometimes use proxy variables that are believed to be correlated with unobserved confounders, though this approach has its own limitations.
- Sensitivity Analysis: Performing sensitivity analyses to assess how robust causal estimates are to potential unobserved confounding is a crucial practice.
Time-Varying Causality and Dynamic Networks
Many causal relationships are not static but evolve over time. Characterizing time-varying causality and analyzing dynamic networks, where the strength or even existence of causal links changes, presents significant methodological hurdles.
- Granger Causality: This statistical concept tests whether past values of one time series predict future values of another time series, even after accounting for the past values of the second series. While often used for causality, it’s more accurately described as predictive causality and doesn’t always imply direct manipulation.
- Dynamic Bayesian Networks: These extend standard Bayesian networks to model temporal dependencies and allow for causal inference in dynamic systems.
Ethical Considerations in Causal Intervention
As our ability to identify and manipulate causal levers within complex systems improves, ethical considerations become increasingly prominent. Intervening in social or biological systems carries the responsibility to assess potential unintended consequences.
- Precautionary Principle: When facing uncertainty about severe or irreversible harm, the precautionary principle suggests taking preventive action, even in the absence of full scientific certainty.
- Justice and Equity: Causal interventions should be evaluated not only for their effectiveness but also for their fairness and impact on different population groups.
The causality network is a ubiquitous and intricate concept that spans all domains of human inquiry. From understanding disease progression in medicine to predicting economic trends or designing effective public policies, unraveling these complex relationships is paramount. By applying rigorous methodologies, embracing diverse modeling techniques, and acknowledging inherent limitations, researchers continue to advance our comprehension of the interwoven tapestry of cause and effect, ultimately empowering us to navigate and shape the world around us with greater precision and foresight.
FAQs
What is a causality network graph?
A causality network graph is a visual representation that illustrates the cause-and-effect relationships between different variables or events. It helps in understanding how one factor influences another within a system.
How is a causality network graph different from a correlation graph?
While a correlation graph shows the statistical association between variables, a causality network graph specifically depicts directional cause-and-effect links, indicating which variables directly impact others.
What are the main components of a causality network graph?
The main components include nodes (representing variables or events) and directed edges or arrows (indicating causal influence from one node to another).
In which fields are causality network graphs commonly used?
They are widely used in fields such as epidemiology, economics, social sciences, systems biology, and engineering to analyze complex systems and identify causal relationships.
How is causality determined in a causality network graph?
Causality is often inferred using statistical methods, experimental data, or domain knowledge. Techniques like Granger causality, structural equation modeling, and Bayesian networks are commonly employed.
Can a causality network graph show feedback loops?
Yes, causality network graphs can represent feedback loops where variables influence each other reciprocally, forming cycles within the network.
What software tools are available to create causality network graphs?
Popular tools include R packages (e.g., bnlearn), Python libraries (e.g., NetworkX, CausalNex), and specialized software like TETRAD and Gephi.
Are causality network graphs always definitive proof of causation?
No, while they suggest causal relationships, establishing definitive causation requires careful experimental design and validation beyond the graph itself.
How can causality network graphs aid decision-making?
By revealing how variables influence each other, these graphs help identify key drivers and potential intervention points, supporting more informed and effective decisions.
What challenges exist in constructing causality network graphs?
Challenges include data quality, confounding variables, distinguishing causation from correlation, and computational complexity in large networks.